Shopify Conversion Rate: What's Normal for Your Price, and How to Push It Up With Real A/B Tests
The average Shopify store converts at about 1.4%, not 12%. What's normal for your price, how to find your funnel leak, and the A/B tests that push it up.


Every successful video about Shopify conversion rate has a thumbnail like this one: 0.2% on the left, 12% on the right.
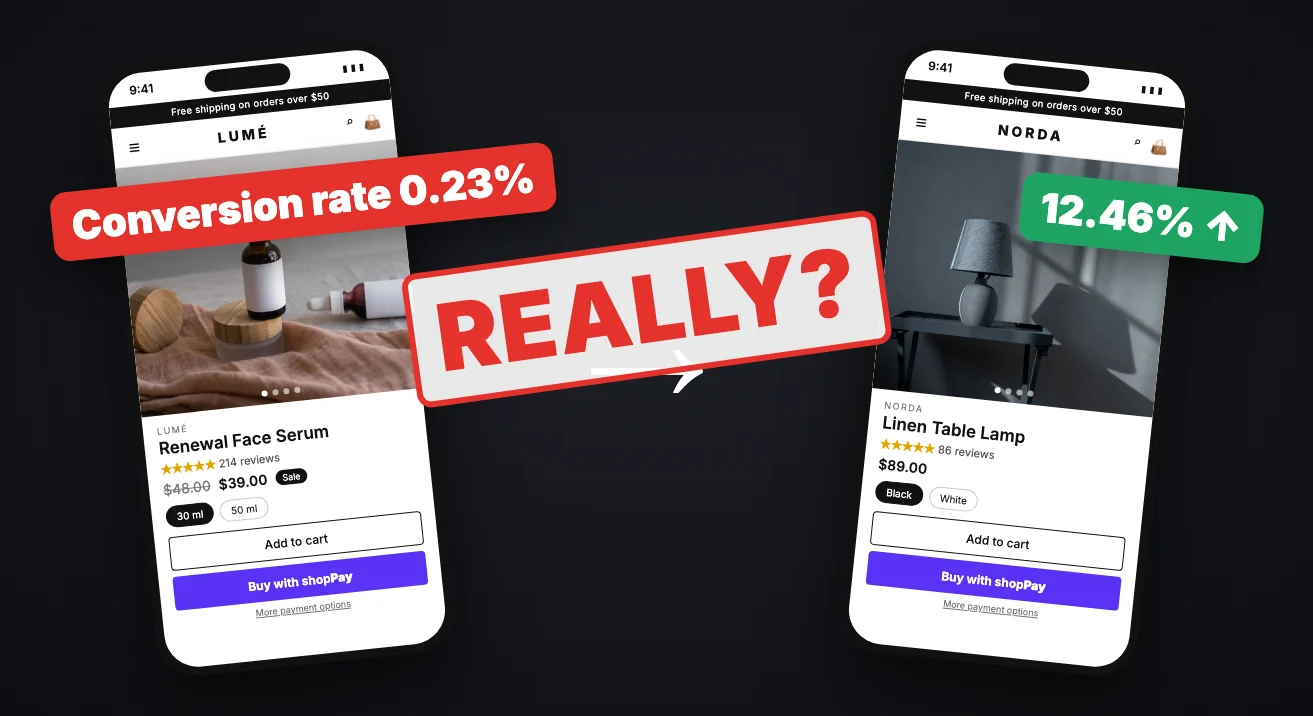
Here’s the truth. The average Shopify store converts at around 1.4%. My own high-ticket store usually converts at around 0.2%, and it’s profitable. So forget the 12%. It’s not realistic for a normal store.
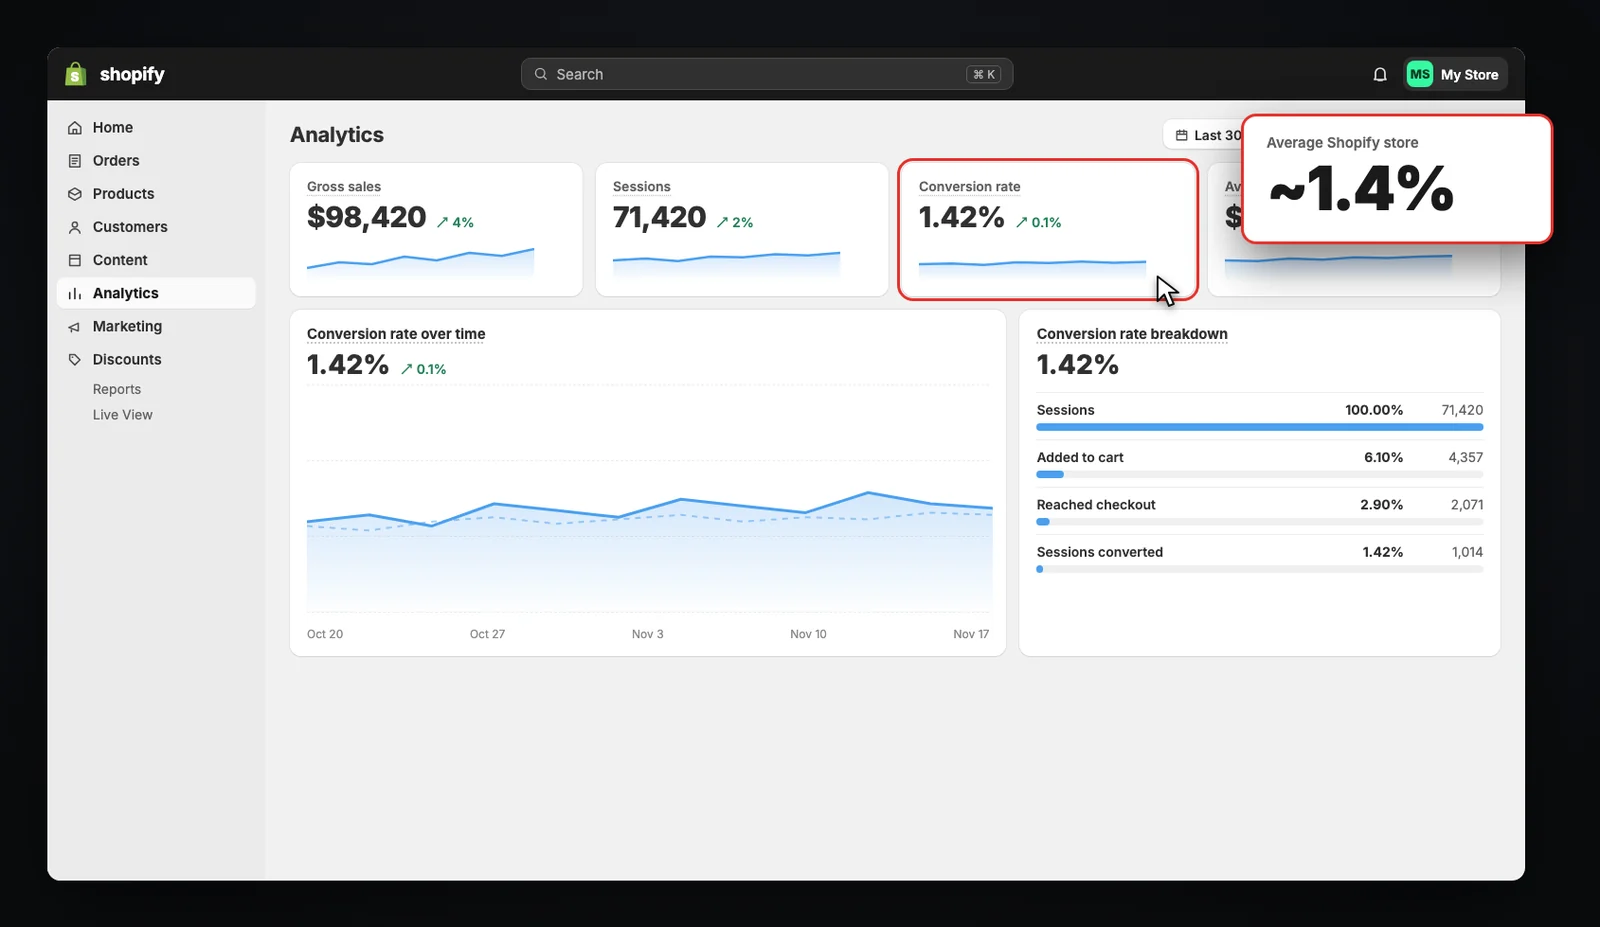
Why a 12% conversion rate screenshot means nothing
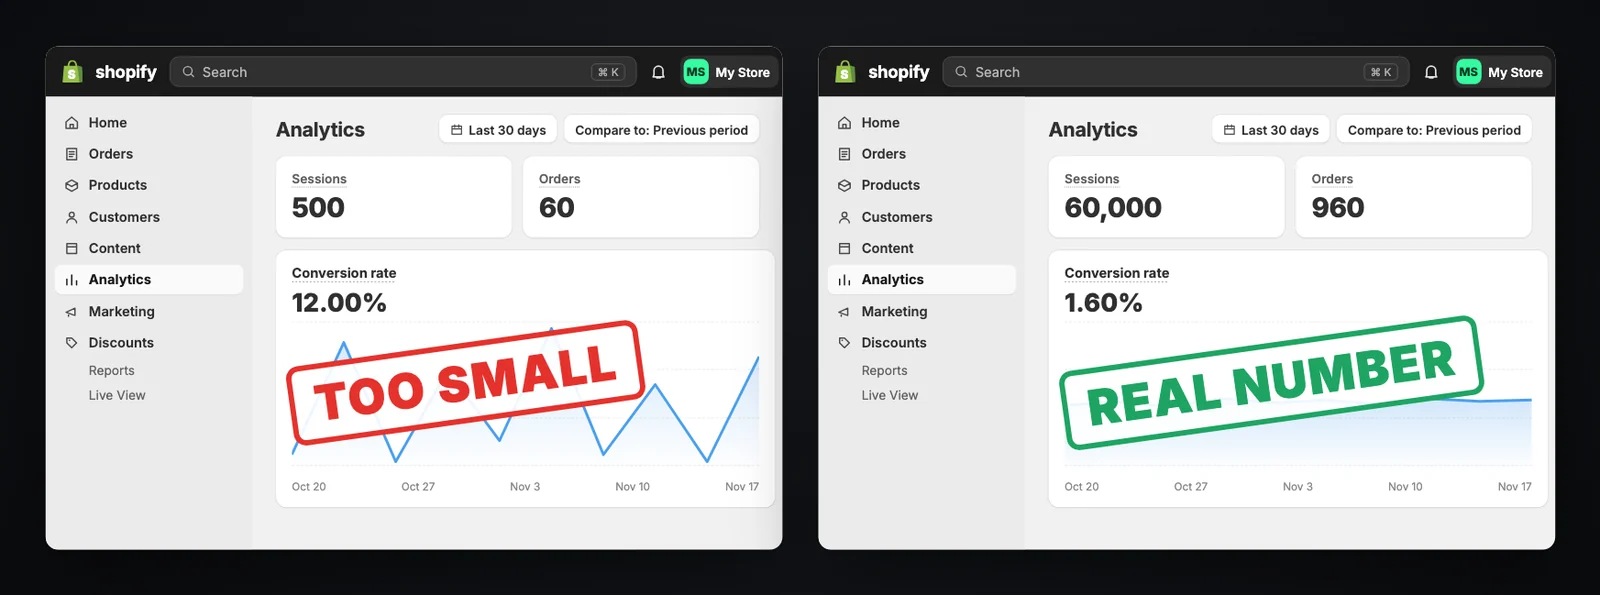
When someone shows you a big conversion rate from 500 visitors, ignore it. Small traffic, big numbers. Big traffic, real numbers. Sixty orders from 500 sessions is 12%; a week later the same store can be at 3%.
You can only judge a conversion rate on thousands of visitors, across normal weeks and busy ones like Black Friday, when everyone converts better.
Then there are the guides: most of them are a list of things to add, with no data behind them. Follow them blindly and they can hurt your store, because without a test you never know what wins and what loses.
Here’s an example. I put a five-star review in the cart of my own store. Sounds smart, right? Every guide tells you to add more reviews. Revenue per session dropped 45.6%. I stopped that test.
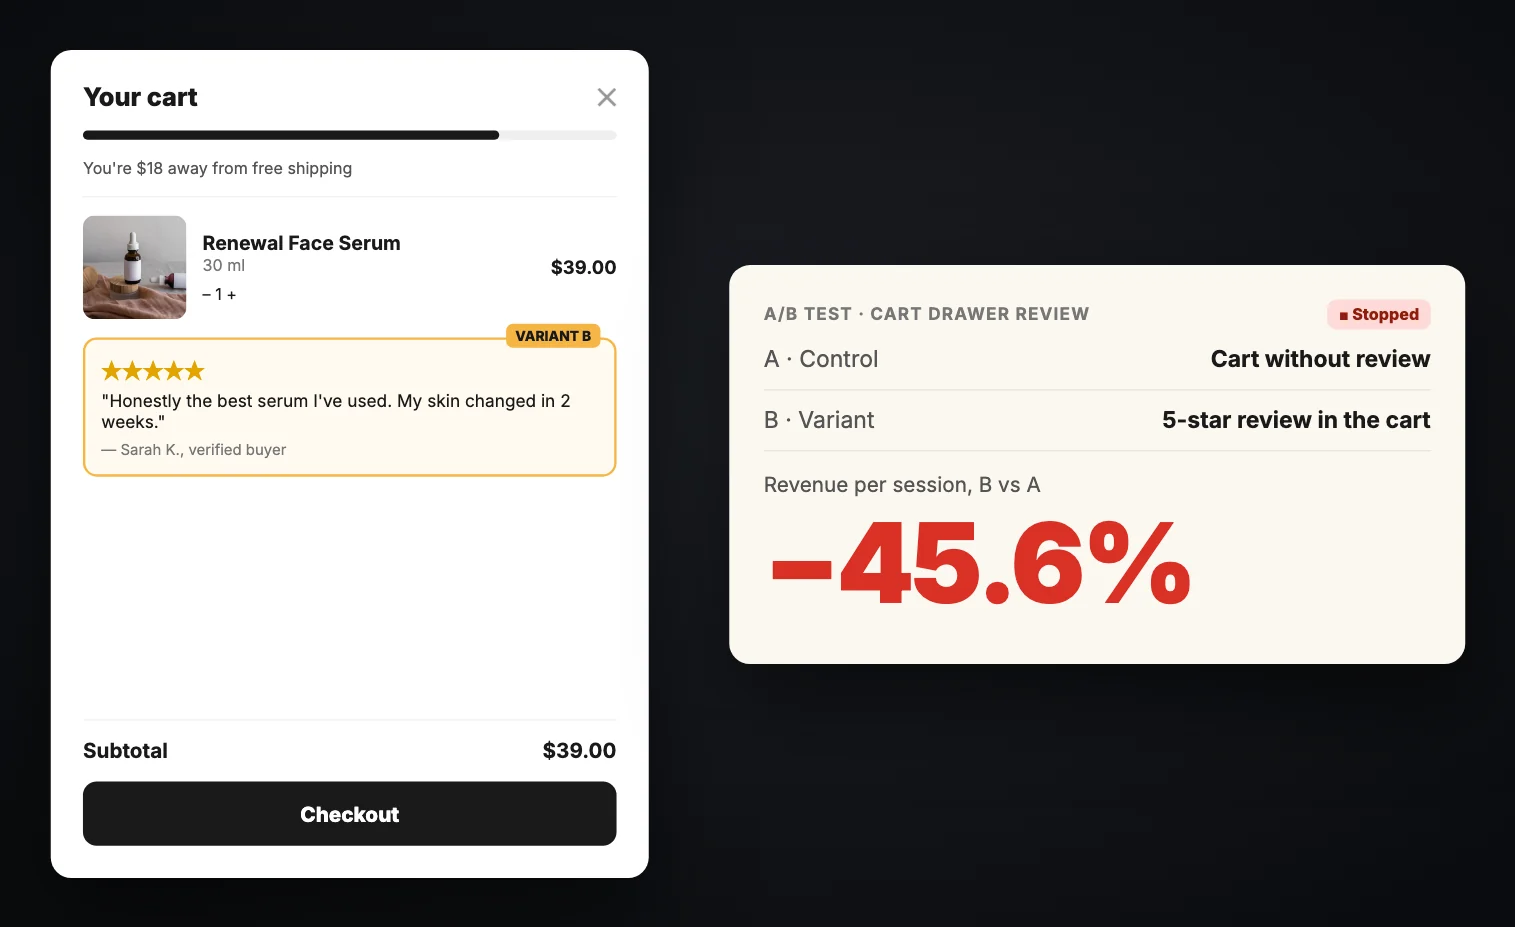
So don’t guess. Test, keep the winners, and stack them.
Is your conversion rate a problem? Do the math first
Let’s take an example: a store doing $100,000 a month, at a 1% conversion rate, with a $140 average order. That’s about 71,000 visitors and 714 orders a month.
After the product, shipping and fees (45%), the ads ($30,000) and the team, apps and everything else ($30,000), this store loses about $5,000 a month.
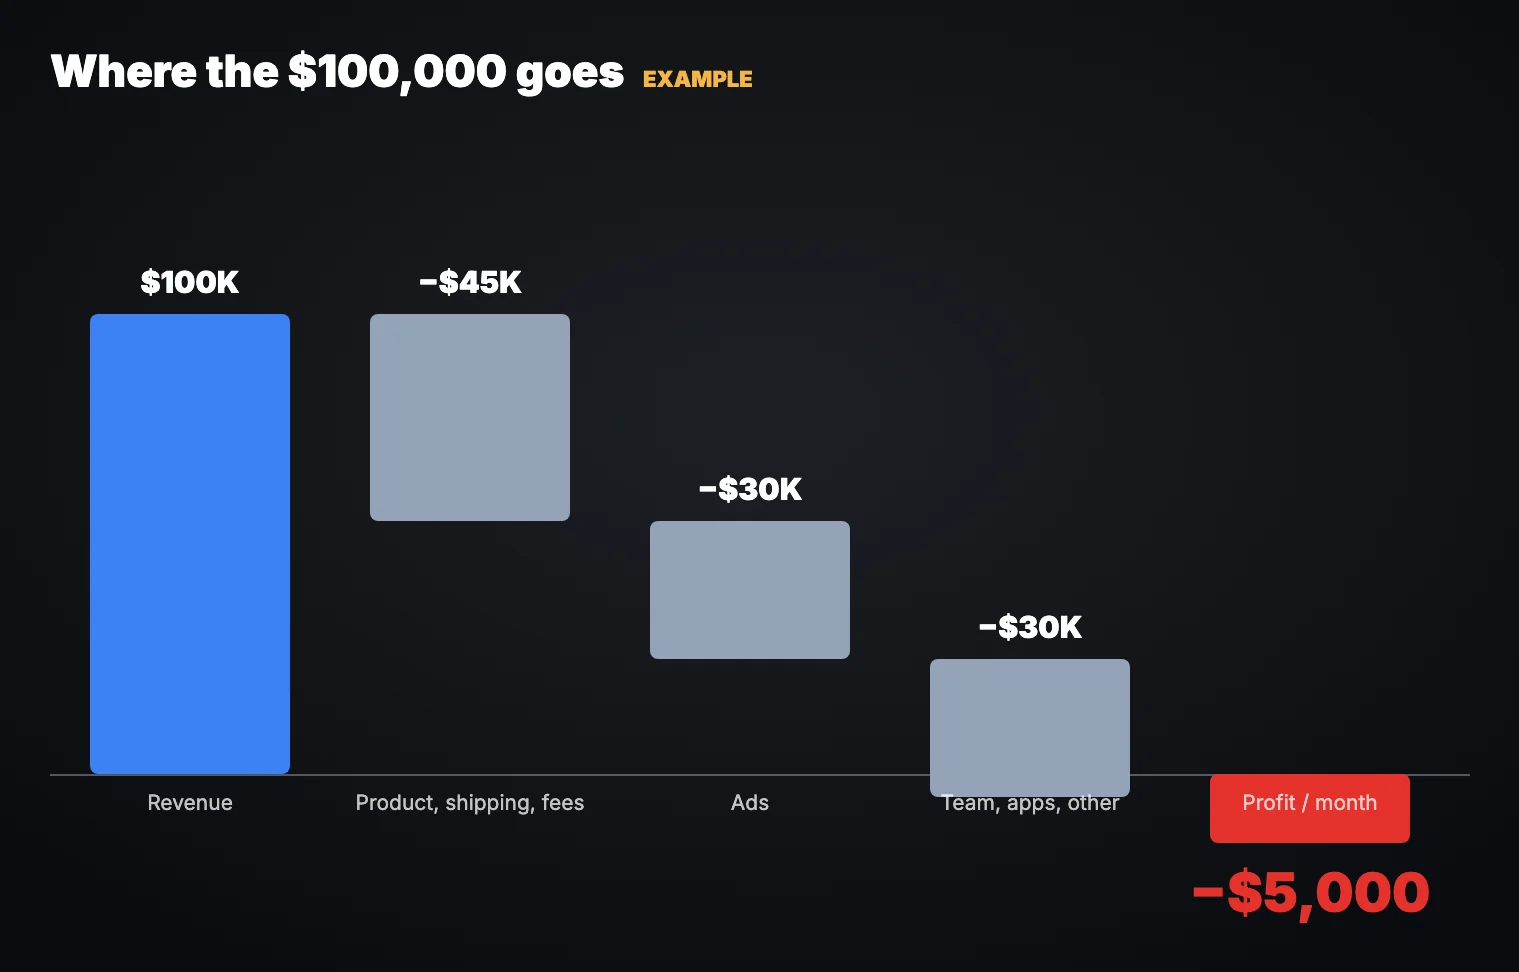
To break even, it needs about 9% more revenue. But break-even isn’t the goal. Say we want $20,000 a month in profit, with the same traffic and the same ad budget:
| Now | Target | |
|---|---|---|
| Conversion rate | 1% | 1.2% (+20% buyers) |
| Average order | $140 | $170 (+20%) |
| Revenue | $100K | ~$146K |
| Ad budget | $30K | $30K |
| Profit per month | −$5K | +$20K |
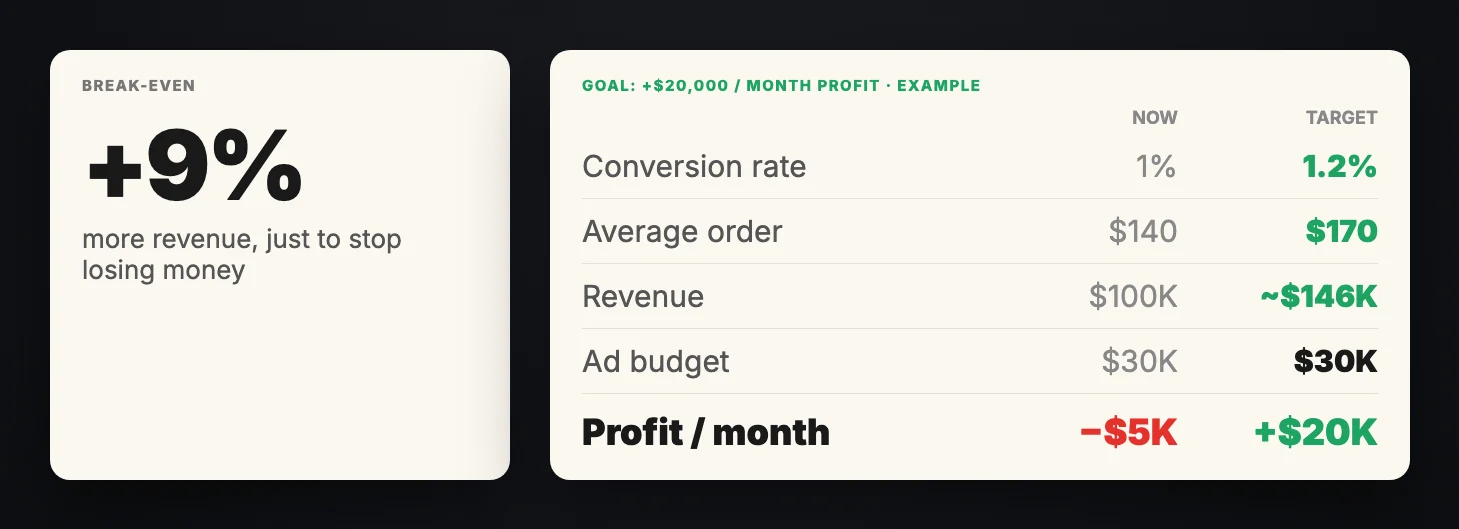
Sounds like a lot? It’s about eight winning tests of 5% each. I’ll show you below how that adds up.
To do this math for your own store, use my free break-even conversion rate calculator: your break-even, and the conversion rate and order value you need to be profitable.
The higher your price, the lower your conversion rate
One percent isn’t bad for every store. A $30 t-shirt and a $2,000 ring will never convert the same. A low conversion rate is a problem only when it costs you money.
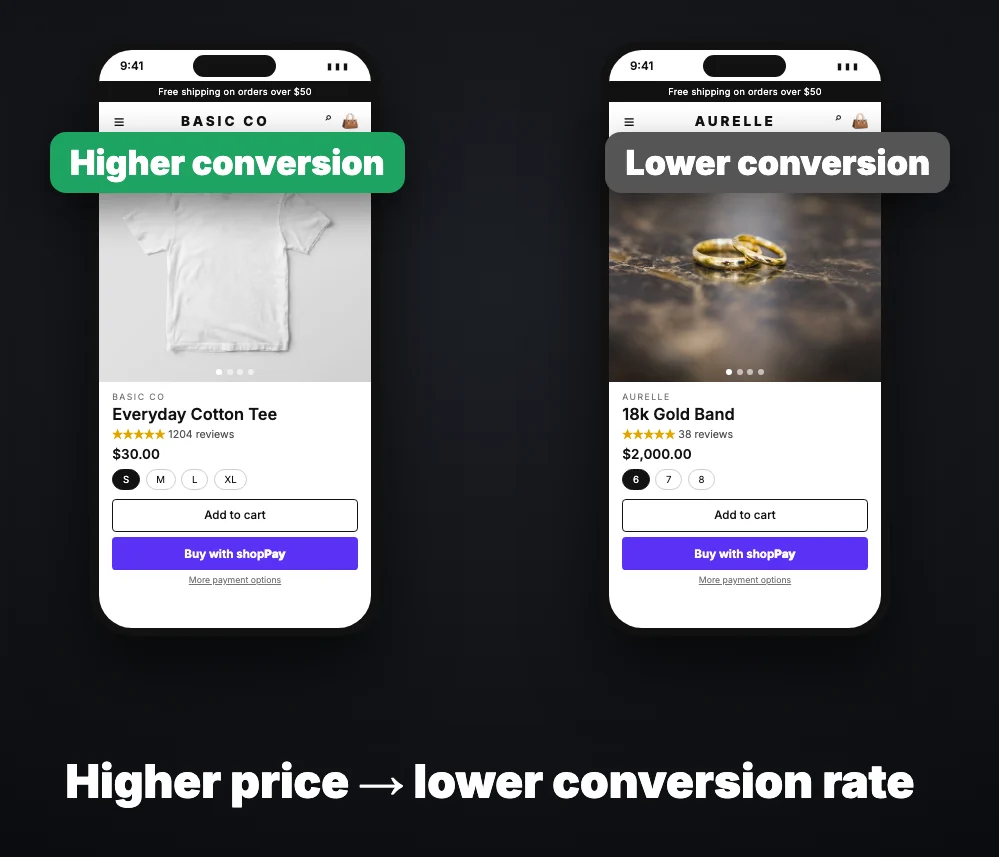
(For the full table by industry and device, see the ecommerce conversion rate benchmarks.)
Where to start: the ads first, then the website
There are two places to improve your conversion rate. First the ads, then the website.
Level 1: the ads
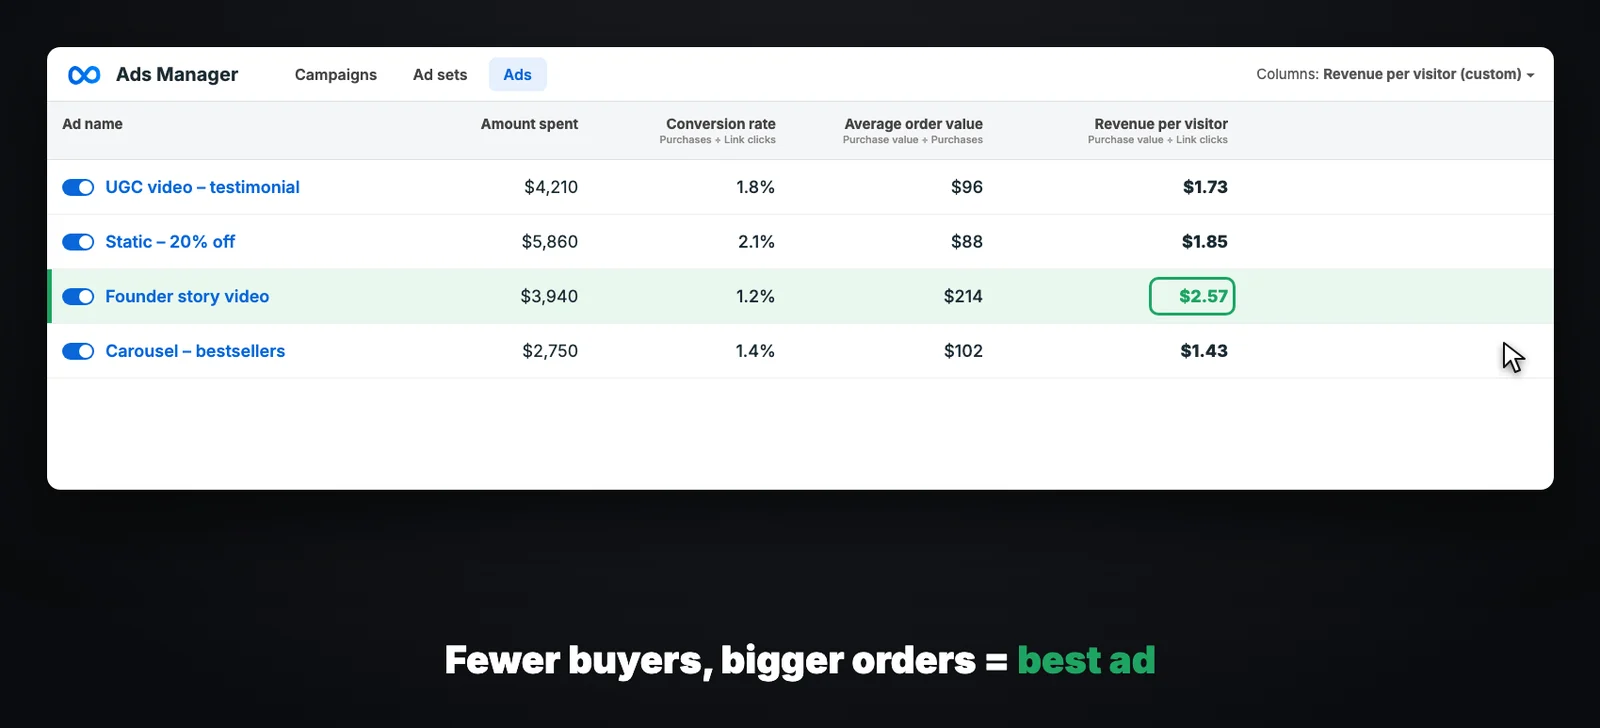
Not every ad brings the same people. Some bring buyers, others bring browsers. For every ad in Meta Ads Manager, add three custom columns:
- Conversion rate = purchases ÷ link clicks
- Average order value = purchase value ÷ purchases
- Revenue per visitor = purchase value ÷ link clicks
An ad with fewer buyers but bigger orders can be your best ad. Push the ads and offers with the highest revenue per visitor.
Then look at your traffic sources. Very often I see something like this: email converts at 3%, Google at 1.5% and Meta at 0.2%, and Meta brings 70% of the traffic. The website isn’t the problem; one traffic source is pulling everything down.
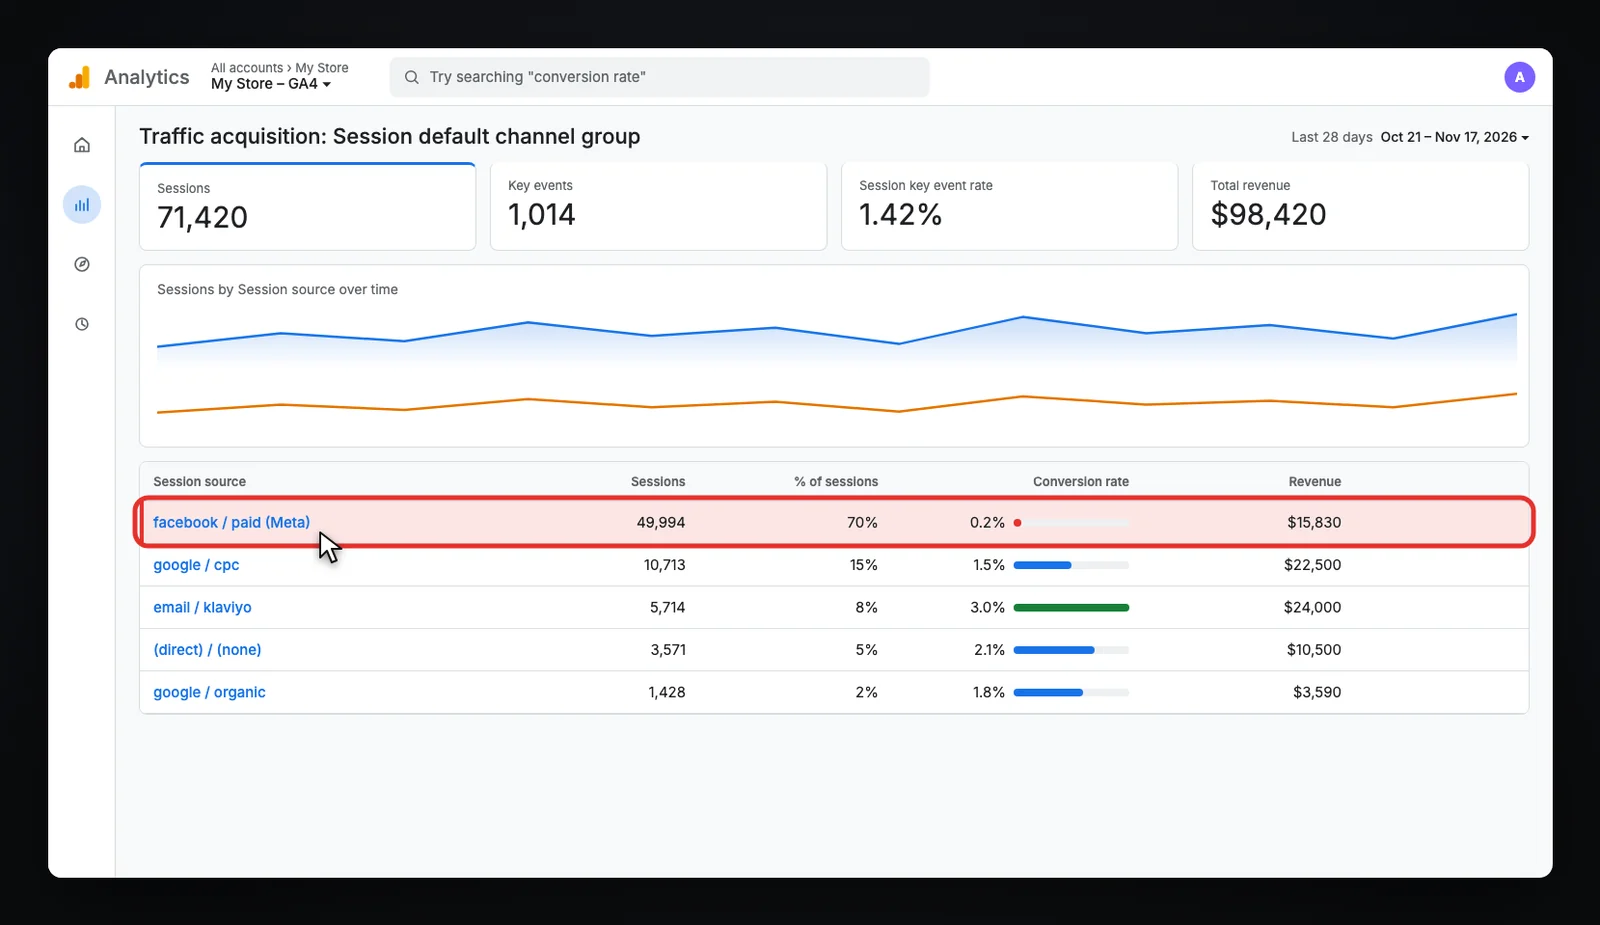
If that’s you, fix the ads first: the campaign objective, the ads themselves, where people land and the offer waiting for them. If your campaign is optimized for clicks, Meta finds you people who love to click, not people who buy. Switch it to Sales, optimized for Purchase. (More on this in Shopify traffic but no sales.)
Level 2: the website
If every source is low, it’s the website. A lot of people start by redesigning the whole store, but a redesign without a diagnosis is like painting a car with a flat tire: it looks better, it still doesn’t move. Don’t redesign. Find the leak.
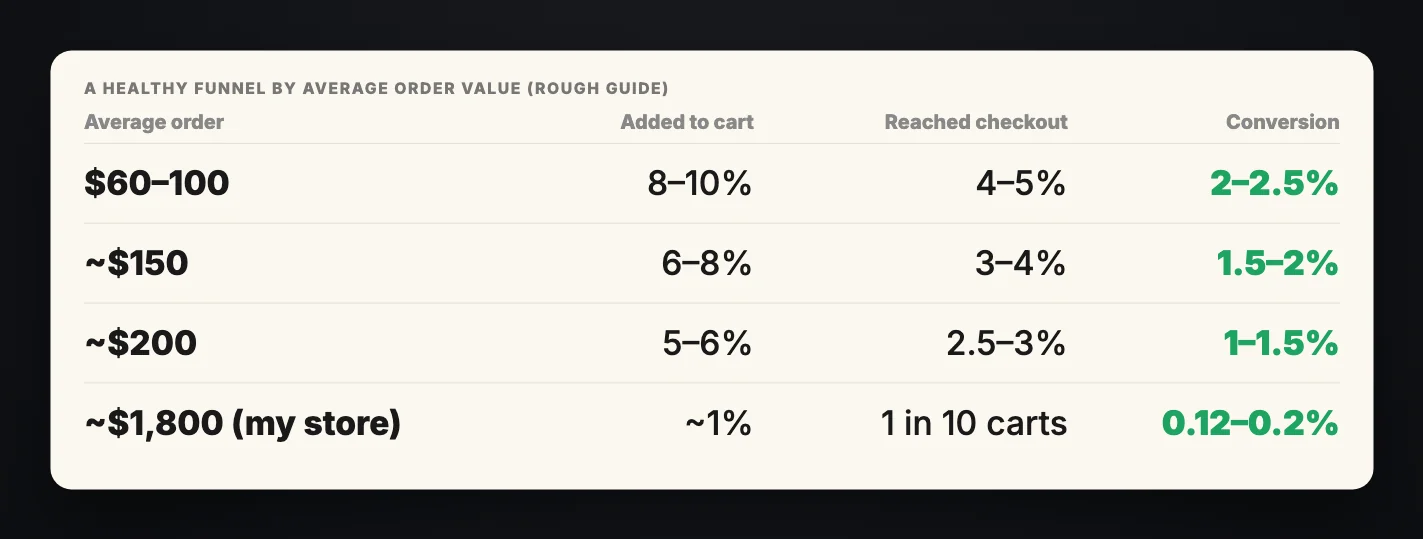
Open Shopify Analytics and find the conversion rate breakdown: added to cart, reached checkout, and completed checkout. What’s healthy depends on your price:
| Average order | Added to cart | Reached checkout | Conversion |
|---|---|---|---|
| $60–100 | 8–10% | 4–5% | 2–2.5% |
| ~$150 | 6–8% | 3–4% | 1.5–2% |
| ~$200 | 5–6% | 2.5–3% | 1–1.5% |
| ~$1,800 (my store) | ~1% | 1 in 10 carts | 0.12–0.2% |
The half rule: find your leak in 30 seconds
Take your add to cart rate and cut it in half: that’s roughly where your reached checkout should be. Cut that in half again: that’s roughly where your conversion rate should be.
For example, if 9% add to cart, around 4.5% should reach checkout. If only 2% do, that’s your leak. The step with the biggest drop is where your first test goes.
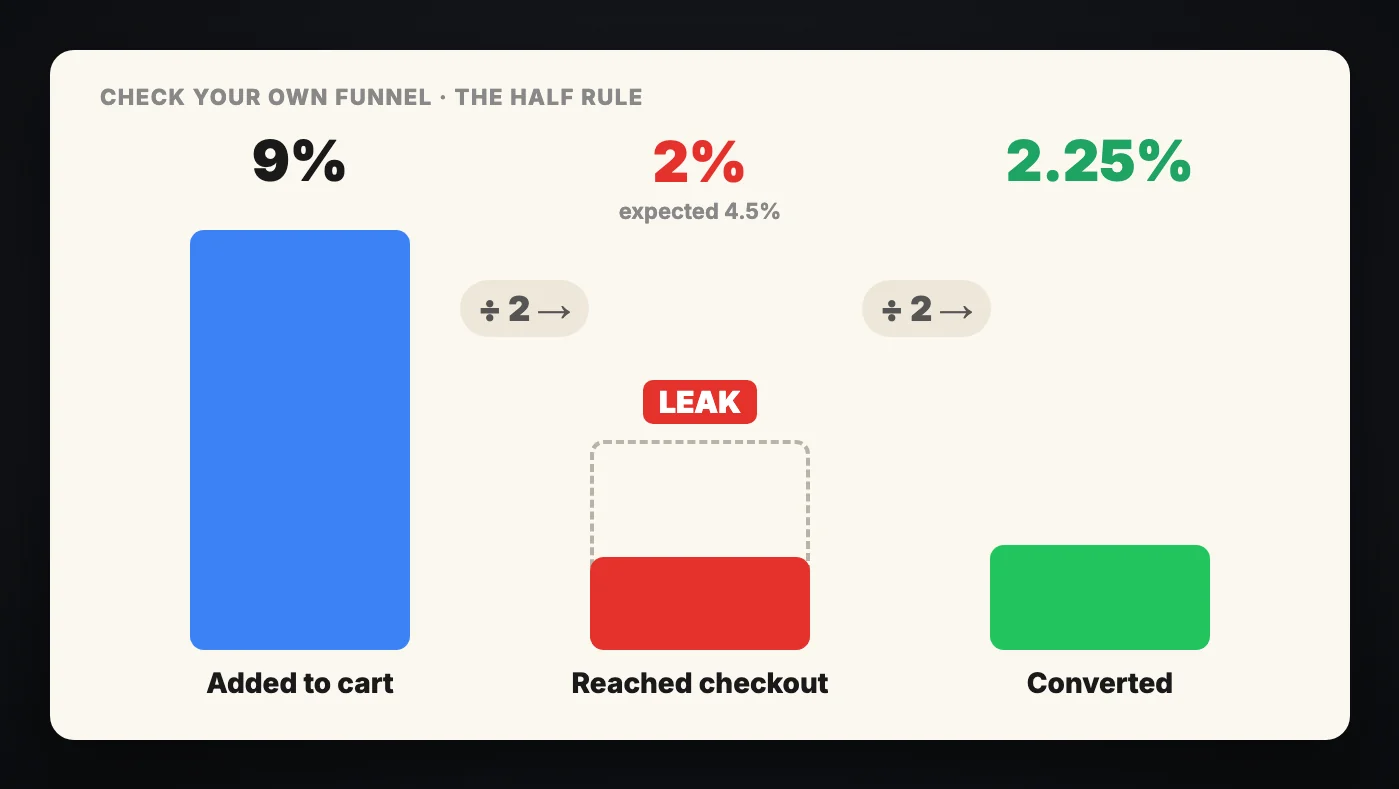
(Very expensive products don’t follow the halving neatly; there, compare each step with your own history. The full method is in Shopify funnel analysis.)
Stack the winners: five real A/B tests on one store
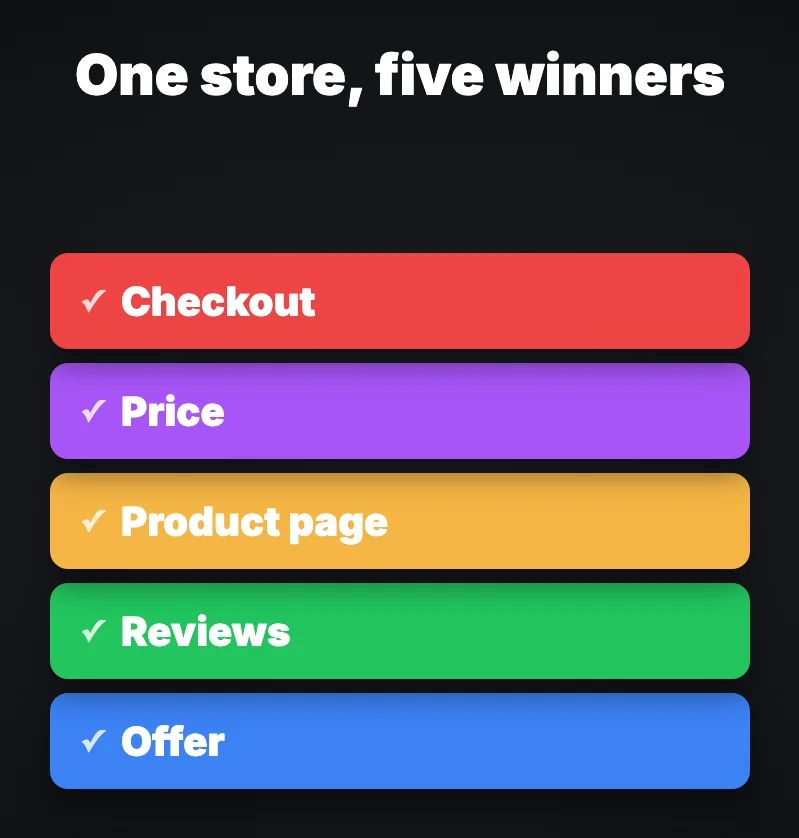
One fix won’t take you to the top. The stores with the highest conversion rates don’t have one big secret: they test every page, switch off what loses, keep what wins and stack the winners one on top of the other. Here are real A/B tests from different stores. Picture them on one store, one after the other.
Test 1: the offer
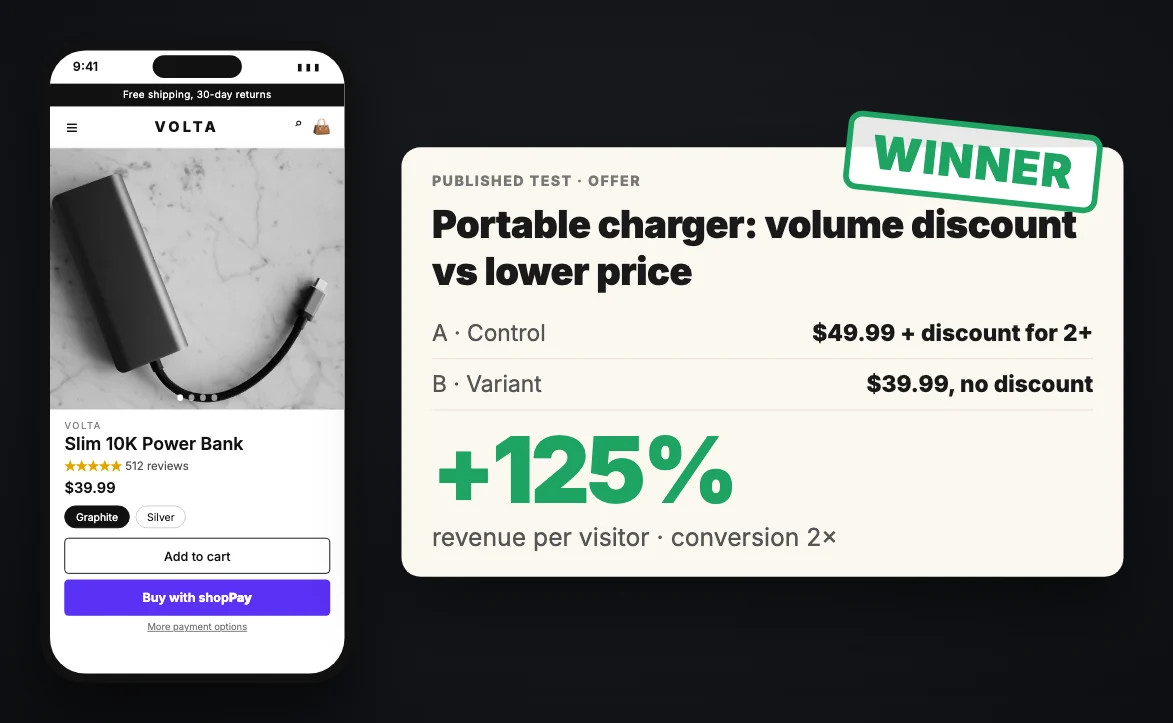
Before people look at your photos, they look at your deal. In a published test (Intelligems), a brand selling a portable charger gave a discount if you bought more than one, and tested it against a lower price with no discount at all. Conversion doubled and revenue per visitor went up 125%. A simpler offer, twice the buyers.
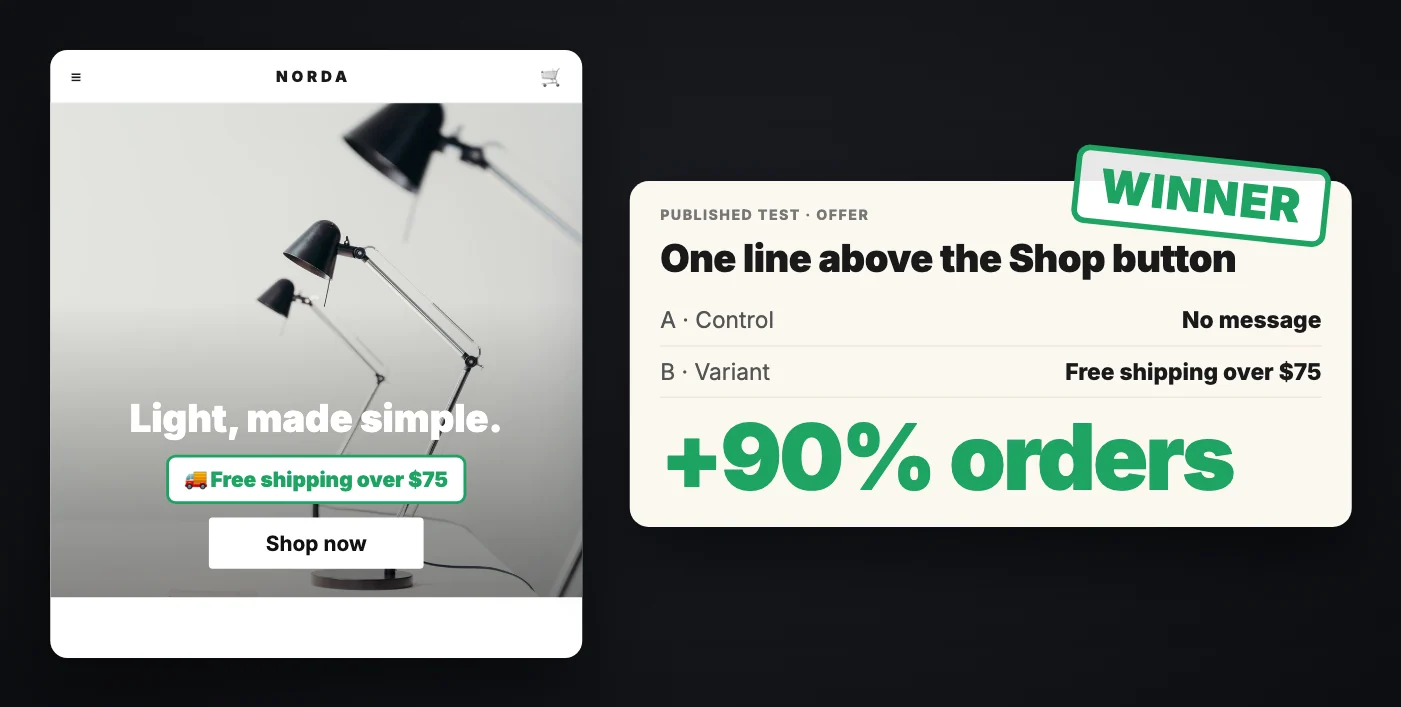
In another published test (NuFace, via VWO), one line, “Free shipping over $75”, right above the Shop button: orders up 90%.
Test 2: the reviews
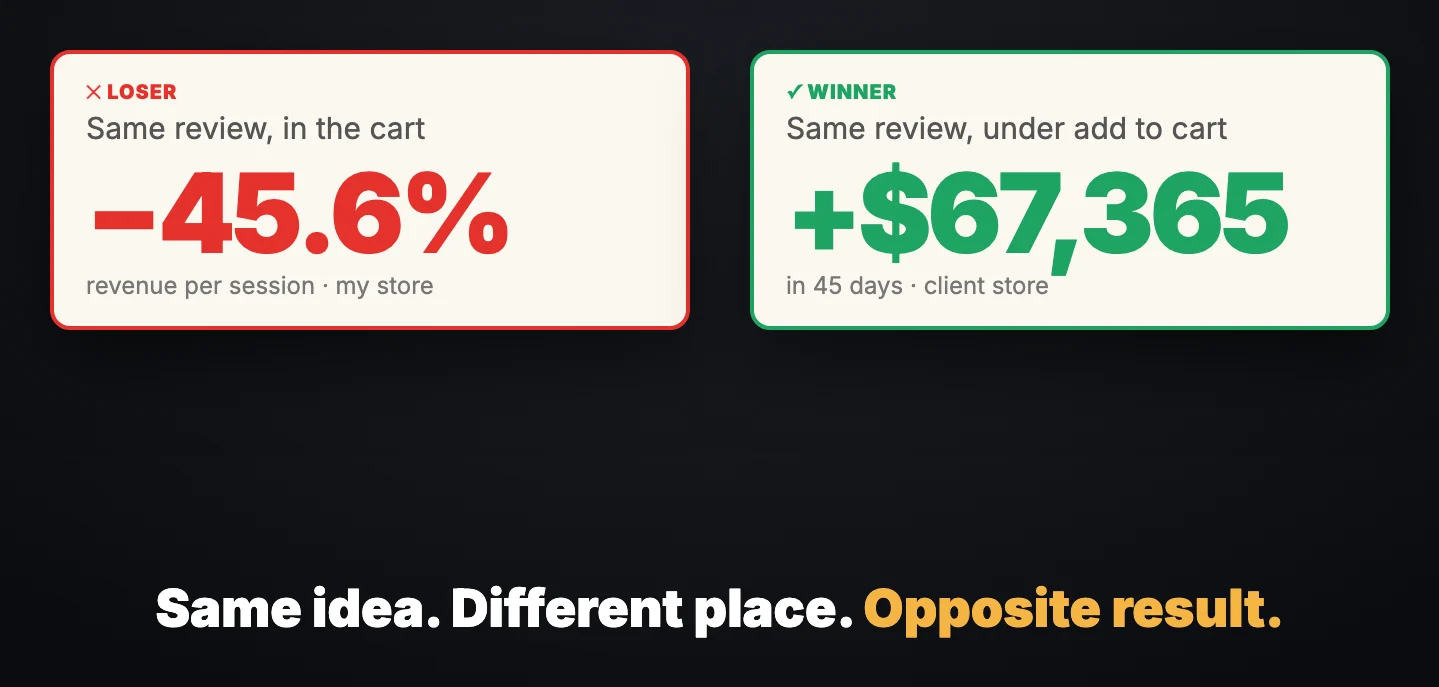
Remember the review I put in my cart? Revenue per session down 45.6%. Loser, switched off. It cost a few days, not a fortune.
On a client store we put a review in a different place: one customer review that answered the biggest question buyers had, right under the Add to Cart button. $67,365 more in 45 days. Same idea, different place, opposite result. (The full story: one review under Add to Cart.)
On another client store we added a second tab with all the store’s reviews on every product page. Sales went up 8%, without collecting a single new review.
Test 3: the product page
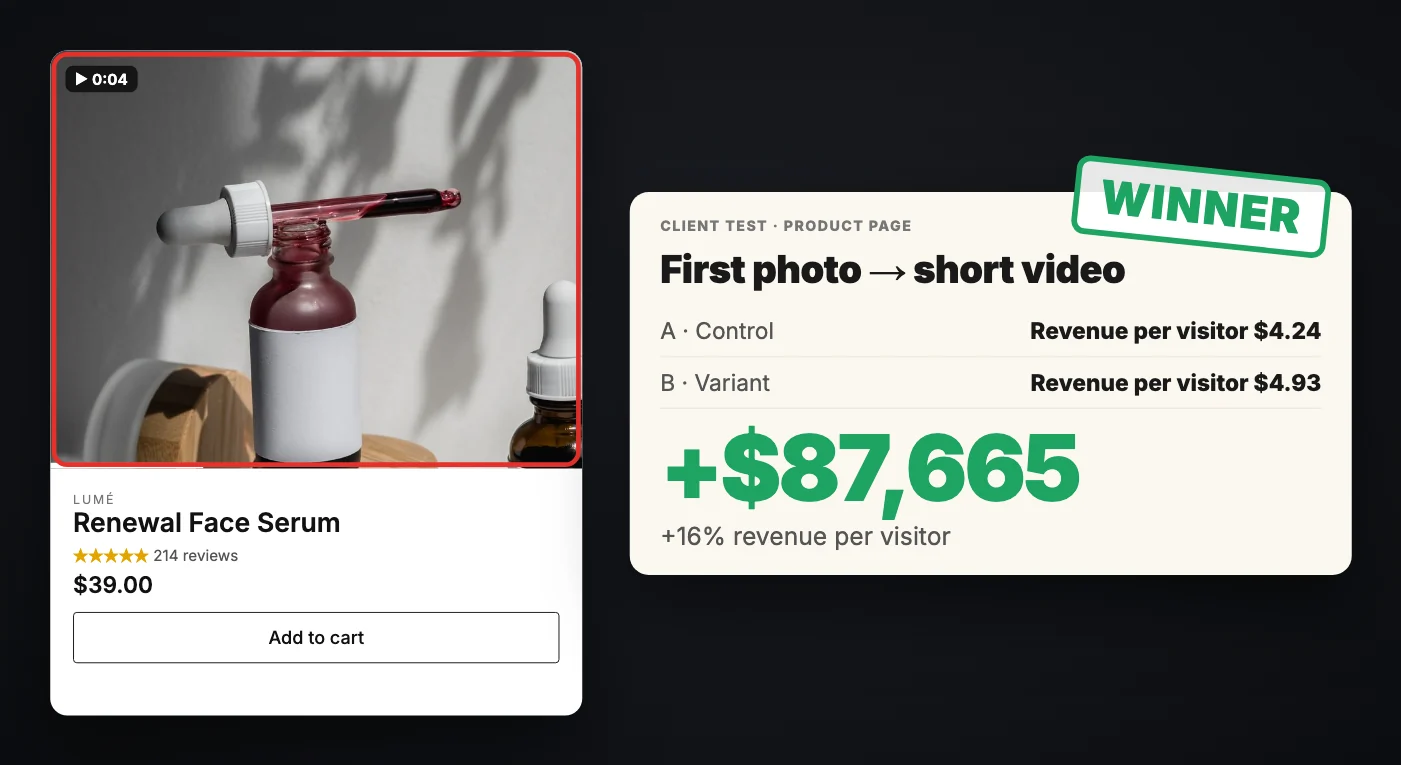
Your visitors can’t touch the product, so the first thing they see has to sell it. On a client store we replaced the first product photo with a short video. Revenue per visitor went from $4.24 to $4.93: $87,665 more.
Test 4: the price
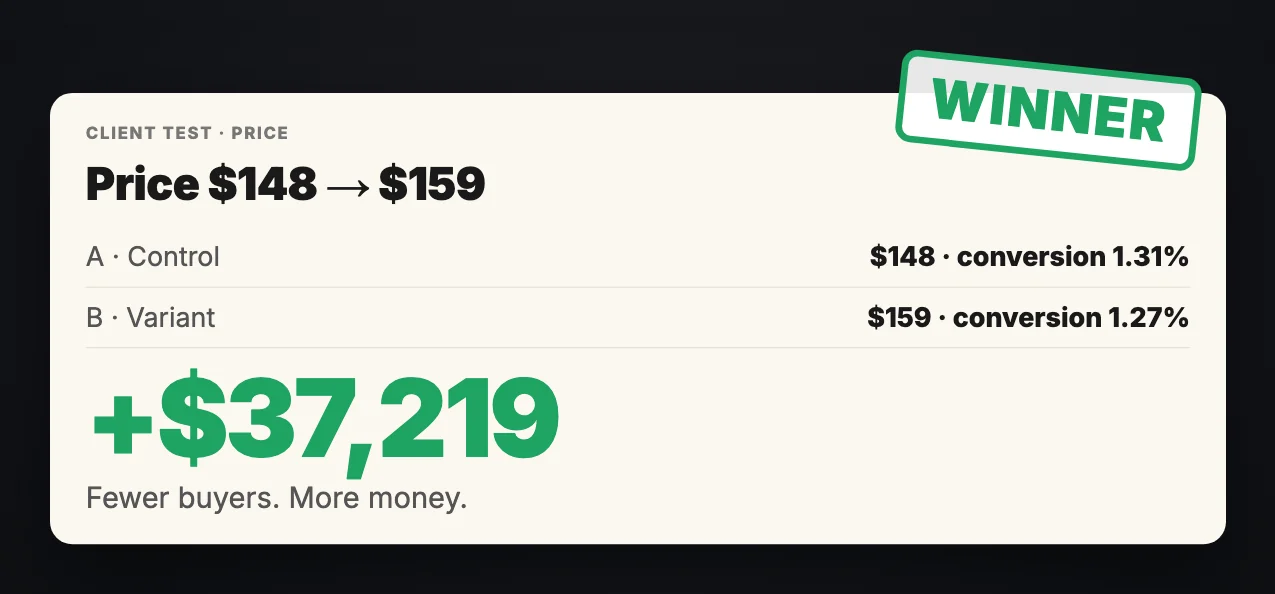
This one surprises people. We tested raising a price from $148 to $159. The conversion rate went down, from 1.31% to 1.27%. Fewer people bought, and the store made $37,219 more. (More on it in the price increase test.)
That’s why the number I really care about isn’t conversion rate. It’s revenue per visitor: how much money every visitor brings. Don’t chase the percentage. Chase the revenue.
Test 5: the checkout
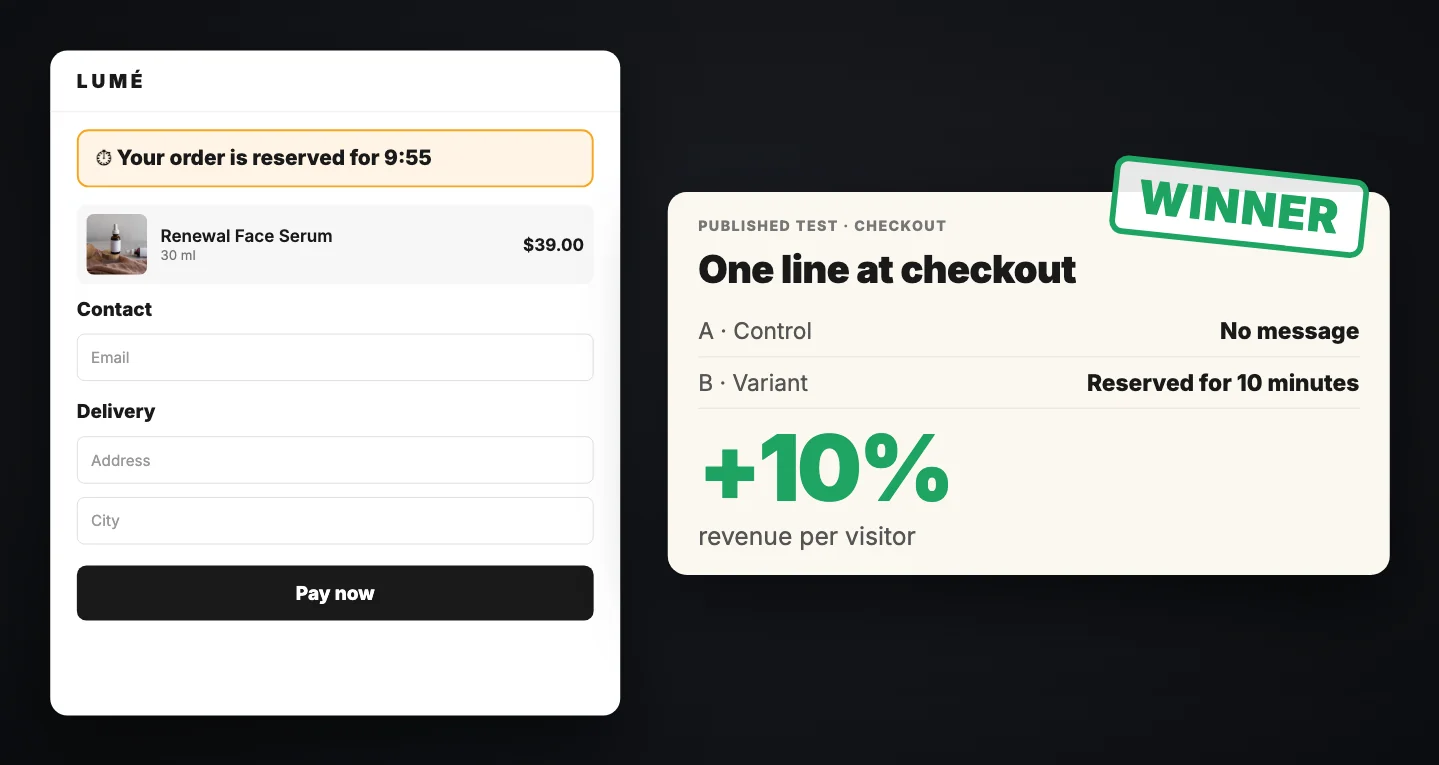
The last step, where people already have their card in their hand. In a published test (M. Abdullah), one line at checkout, “Your order is reserved for 10 minutes”, lifted revenue per visitor by 10%.
Wins don’t add up. They multiply
Now look at what’s left: a better offer, better reviews, a better product page, a better price, a better checkout. Every page sells a little better, and every visitor brings more money.
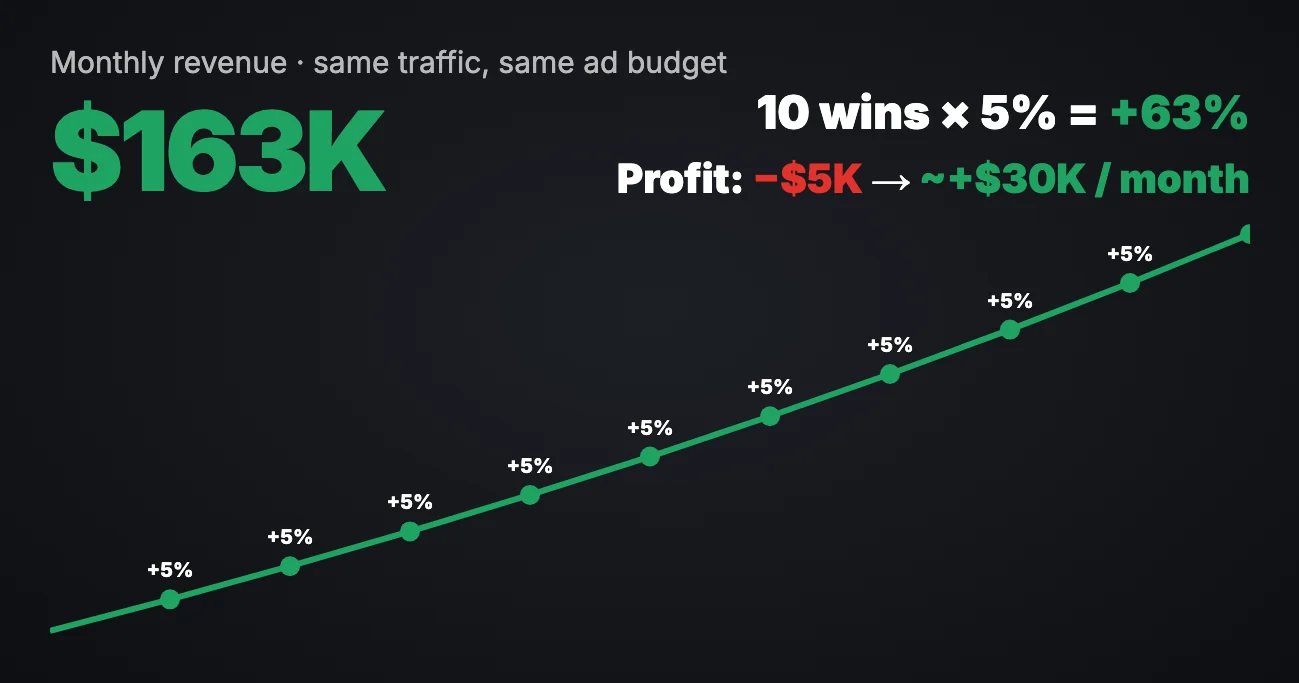
And you don’t need wins this big. Find 10 winners in a year, each only 5%, and your revenue grows by more than 60% (1.05¹⁰ = 1.63). Our $100,000 store becomes a $163,000 store, with the same traffic and the same ad budget: from losing $5,000 a month to making almost $30,000.
That’s exactly why you need to test. A change that won on someone else’s store can lose on yours, just like my review in the cart. Don’t copy it. Test it, and if it wins, stack it.
Most tests lose. That’s normal
Most people think every idea they have will work. It won’t. At Microsoft, only about one idea in three moved the numbers the right way (Ronny Kohavi). At Booking.com, about one in ten (Lukas Vermeer). If you run 10 tests, expect most of them to lose.
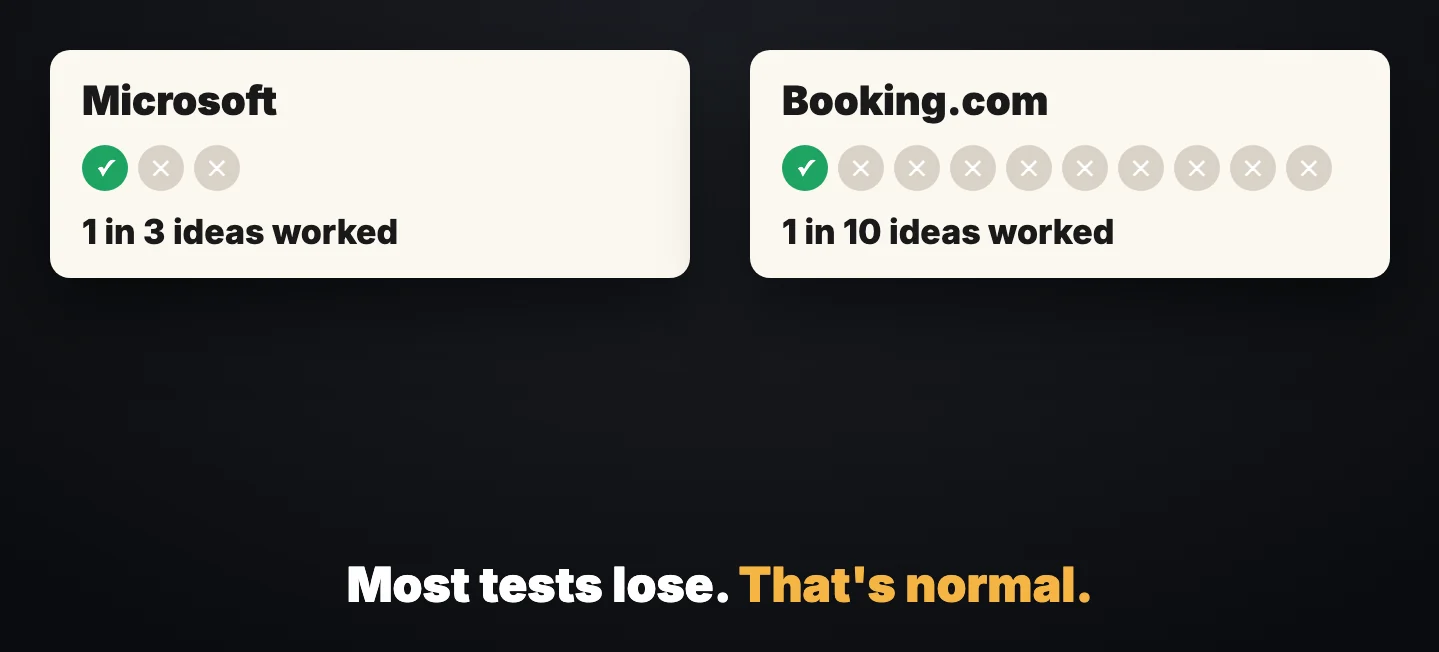
A loser costs you nothing once you switch it off. A winner keeps paying you, every single day.
Recap: if your Shopify conversion rate is low
- Know your numbers: your break-even, and the conversion rate and order value you need to be profitable. The calculator does it for you.
- Check the ads: push the ones with the best revenue per visitor, and see if one traffic source is pulling everything down.
- Read your funnel: use the half rule. The step with the biggest drop is where your first test goes.
- Test every page: the offer, the reviews, the product page, the price, the checkout. Switch off the losers and stack the winners.
Want 100 more ideas to test? Here’s how to improve conversion rate on Shopify: 100 ways, each with a real example.
And if you want the system I use with brands, where the hidden revenue is, which tests to run first and how to know what actually worked, watch my free training. You also get free access to my library of more than 1,000 A/B tests.
Frequently asked questions
What is a good conversion rate for a Shopify store?
The average Shopify store converts at about 1.4% of sessions; the top 20% are above 3.2% and the top 10% above 4.7% (Littledata, about 2,800 stores). But it depends on your price: a store with a $60–100 average order can aim for 2–2.5%, while a high-ticket store can be healthy at 0.12–0.2%.
Is a 1% conversion rate bad on Shopify?
It's below average, but it's only a problem when it costs you money. A $2,000 product at 1% can be very profitable; a $30 product at 1% usually isn't. Work out the conversion rate and order value you need to break even and to make a profit, then improve from there.
How do I find what is lowering my Shopify conversion rate?
First check the ads: compare conversion rate, average order and revenue per visitor for every ad, and conversion rate per traffic source. If every source is low, open the conversion rate breakdown in Shopify Analytics and use the half rule to find the step with the biggest drop.
Why does my conversion rate go down when I raise my price?
Fewer people buy at a higher price, but each order brings more money. In a client test, a price change from $148 to $159 lowered the conversion rate from 1.31% to 1.27% and still made $37,219 more. That's why revenue per visitor matters more than conversion rate.
How many A/B tests win?
Fewer than you'd think. At Microsoft about one idea in three moved the numbers the right way; at Booking.com about one in ten. A losing test costs you little once you switch it off; a winner keeps paying every day.
Alexander Skibinskiy
17 years in digital marketing and e-commerce. Former head of growth at Karma and Luck, a nine-figure brand, where conversion rate grew 50% in one year of A/B testing. Founder of a seven-figure e-commerce brand; 100+ brands helped since 2015. More about Alexander →
Watch the free training →